Webinar with James Siddle - Multinetwork Data Analysis
In this webinar James and I talk through the mulit-network data analysis that he has completed to identify the knowledge flows between experts on the Zapnito platform.
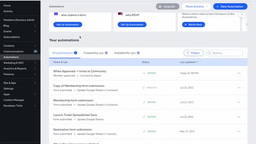
James and I talk through some of the history of his data analysis work and discover some interesting insights into how expert communities when viewed from a multi-network perspective can provide deeper insights into how knowledge flows between, not just within communities.
Community centrality within the multi-network view becomes a key point discovery and something we expect to be further revealed as we grow.
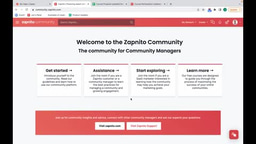
If you're interested in this and some of the other enterprise level capabilities of the Zapnito platform please get in touch.
Video Transcript
00:01
00:04
I'm the CTO and Co-founder of Zapnito
00:07
and with me today, I have Jim Siddle.
00:12
So Jim has been working with us
00:13
sort of on and off over the last few years.
00:17
He's done some work with us in the early days.
00:20
Data analysis, and today we're going to revisit
00:25
some work that we've done over the course
00:27
of the history of Zapnito.
00:28
So hopefully it's gonna be a very interesting
00:29
conversation around the sort of multi-network
00:33
view of Zapnito, so Jim, would you like to introduce
00:36
yourself, who you are and your background?
00:40
00:43
I'm a software engineer by background,
00:46
although a few years ago I started
00:48
to get interested more in data analysis and visualization.
00:51
These days, I'm an IT consultant,
00:54
IT contractor based in London and I've,
00:57
yes, as you say been working with yourselves,
01:00
pulling together a few interesting visualizations,
01:03
looking at some of the characteristics
01:05
of the Zapnito network, looking at sort of the trends
01:08
and also producing some nice visualizations,
01:11
which hopefully tell quite an interesting story.
01:13
01:14
So just quick background on Zapnito
01:17
for those that aren't familiar.
01:19
So we provide essentially a software as a service
01:22
expert community platform,
01:24
and that's mainly used by media companies,
01:28
societies, any company that has online communities
01:32
of experts and they want to bring those experts
01:34
into a branded online community to share,
01:37
to share expertise.
01:38
So in this talk, or in this kind of,
01:43
what's the word?
01:45
Video blog?
01:46
Is it a video blog or is it a webinar?
01:48
Let's make up a word, it's a webinar, probably.
01:51
So James and I will go through some of the background
01:55
of James' work, which is essentially analyzing
01:58
the relationships between the experts on the communities
02:01
and the knowledge, the flows of knowledge between people.
02:06
And so it's quite an interesting topic area for us,
02:09
in terms of understanding how the communities get used,
02:13
not just in a single community perspective,
02:16
but in a multi-community perspective,
02:17
or what we would call multi-network perspective.
02:20
So seeing who those influences are,
02:24
not just based on their following,
02:25
but also who's influential in their multi-community view.
02:31
It's very interesting, and then particularly
02:32
in this used case, we've looked at Springer Nature
02:35
as a used case, 'cause they have many,
02:38
many communities with Zapnito.
02:41
So the background of their data is quite interesting
02:44
from a scientific research perspective as well, so.
02:49
So just, let's dive in, let's not waste any time.
02:51
Let's get to the exciting stuff.
02:53
(laughs)
02:56
So, Jim, do you want to give us a background
02:57
onto the sort of story so far?
03:00
03:02
So essentially, yeah I think we started working on this site
03:07
five years ago now, so as you can see,
03:10
this is a little sort of excerpt from
03:13
the first blog post that was looking
03:18
at the Zapnito network.
03:20
So this was actually showing the very early
03:24
sort of structure, I think just pretty much just after
03:27
you'd kicked off, you know, actually launched the company.
03:30
And so what you can see here is actually the,
03:32
everything, so this was all companies,
03:34
or all you know, sort of, all networks,
03:38
all kind of smushed together,
03:40
so we did a little bit of an interesting sort of story
03:42
telling very early on, looking at some of the early
03:44
trends, basically.
03:46
But things, as you say, moved on quite a lot since then.
03:51
So as you can see on the next slide.
03:52
03:55
What are the blobs, and what are the lines,
03:56
just as sort of an intro?
03:58
04:04
the sort of common pattern is that the,
04:08
each of the blobs represents registered profile experts.
04:12
And each of the connections is potentially the,
04:18
it represents a flow of knowledge between two people.
04:22
So the flow of knowledge being the consumption
04:25
of some article, possibly watching video,
04:29
essentially, you know, the passage of knowledge
04:32
in some form, and also, this one's worth noting,
04:36
the size of each of these blobs is representative
04:39
of the, well I think it actually changes based on
04:42
the different diagrams, but the general trend
04:45
in the Springer Nature diagrams which you'll
04:46
see on the next slides, is that size represents influence,
04:50
and the influence is measured by the reach
04:52
of the spread of knowledge of one of those profiles.
04:56
The idea was to really just represent the profiles,
04:59
the experts and the flows of knowledge.
05:01
05:02
So this diagram represents sort of a very early
05:04
the end of 2014, isn't it?
05:06
October, roughly.
05:08
Where we had two or three customers,
05:11
with a couple of different networks,
05:12
and sort of looking at the overlaps
05:14
of where we were back then,
05:16
and to see, I remember us looking at this back in 2014,
05:18
and we were all kind of,
05:19
our eyes were sort of wide open at the time.
05:21
You think, oh this is incredible,
05:22
and it's really amazing, but sort of now looking at the data
05:26
you produce now, which we'll look at on the next few slides
05:28
it's just, it gives me tingle, gives me goosebumps
05:31
to sort of, to see how we've gone forward, so.
05:34
05:36
let's have a look.
05:37
05:38
Yeah, so as you said there, the next step,
05:41
so this is from last year.
05:43
So we did another iteration, so this was focused
05:47
just on the Springer network expert communities.
05:51
And so yeah, this isn't showing anything else.
05:55
This is really just focused on those scientific communities.
05:59
But again, the principle here was to show
06:02
the, all of those key influences
06:06
and the key knowledge flows, so for example,
06:09
I think there's quite a nice example there,
06:11
you can see in blue.
06:13
There's the, I think that's the microbiology community
06:15
in the Springer Nature network.
06:17
And there are you know, there're a handful of key people
06:20
in that community who, they play an important role
06:24
in disseminating knowledge,
06:26
so they're writing articles, or they're writing papers,
06:29
that a lot of people are viewing.
06:32
And then you can also see there are some,
06:34
there's one example there, where there's a person who
06:36
is sort of bridging two networks from the brown one,
06:41
yeah exactly.
The white dot there
06:43
in the middle is it?
06:44
06:45
And so that, so the white dots by the way,
06:48
in this particular diagram,
06:50
they represent individuals who are members
06:53
of multiple networks.
06:55
So these are people who join, they sort of join multiple
06:58
communities, so they've taken an interest
07:00
and registered their interest in different
07:03
scientific disciplines, and so there's quite a few of those.
07:07
But actually you'll see that the colors represent those
07:09
individuals who are about just part
07:12
of the single community.
07:13
And certainly there are some people who really focus,
07:16
there are some people who really diversify.
07:18
07:20
It's got lots of white dots, isn't there, relatively
07:22
in comparison to its size,
07:24
compared to some of the other ones.
07:26
I don't know if you know which network that is.
07:28
07:30
that's bio-films and microbiomes.
07:33
07:35
07:38
later in the slides, so we can sort of talk
07:40
about that as well.
07:42
I don't think we ever looked into the reasons
07:44
for the, why that has more multiple sort of,
07:47
it may actually be for the reason that we'll--
07:50
07:51
keep it as a surprise.
07:52
Don't wanna steal your thunder on the slides.
07:55
In a general sense, it's obviously you can see
07:58
the transition from where we were in 2014, to 2018,
08:02
in terms of scale and complexity of the multi-network view.
08:06
It's quite a step upwards.
08:09
08:12
interesting, is that sort of at this stage,
08:15
because all of these communities are from a single customer,
08:19
and they represent scientific domains that are,
08:23
either closely related or you know,
08:26
there are definitely relationships
08:27
between these communities.
08:29
I think the network tells a more,
08:31
more interesting story overall,
08:33
than the sort of earlier version that we did,
08:35
was just like, well here's everything,
08:36
let's see what it looks like.
08:37
08:39
08:41
pollination I think.
08:42
08:45
your kind of, it was like a taste of what was possible.
08:48
It was like, oh, you know, kind of like,
08:49
actually we've got something pretty interesting here,
08:51
and to see it actually plan out you know,
08:53
a few years later has been a real story I think.
08:58
Okay.
09:01
09:05
really just a preview of what we've already talked about
09:07
a little bit, which is that in 2019,
09:11
we've done another iteration, so this is an update
09:13
to the data visualization, repeating the process,
09:15
Springer Nature focused again.
09:17
And again, we chose the same visual representation
09:21
and layout broadly speaking.
09:22
It's not identical, but it's, we've attempted to mirror
09:27
the representation from before,
09:28
so that it's possible to just sort of have some consistency,
09:31
for instance in the colors.
09:33
And yeah, the information, the rest of the information
09:35
on this slide is just describing the,
09:37
that it's you know, these registered profiles,
09:39
and the flows of knowledge in the network.
09:42
09:43
09:48
So, yeah, basically the latest iteration,
09:53
as you can see, yeah we have the same,
09:55
roughly the same layout, but the main difference
09:59
in my sort of, we'll see this in the additional
10:03
sort of slides, we'll see the next sort of,
10:05
yeah in the next slides, is essentially scale
10:09
and connectivity of the things that are really
10:13
sort of changing drastically over the course of the year.
10:17
And yeah, I think you can certainly see that just from
10:20
you know, the sort of just visually in the slide,
10:23
you can see that there are a lot more
10:24
of these sort of connections springing up between
10:27
the communities.
Yeah.
10:27
10:31
And so, in terms of the, let's say the metrics of the graph,
10:36
we can see those on the next slide,
10:38
if you want to.
10:39
10:41
actually Jim, because I think when we talked previously,
10:44
we talked a little bit about centrality
10:46
as a measurement scale.
10:49
And you can see obviously,
10:50
I think it's Ecology and Evolution community here,
10:52
kind of in the center, and the microbiology community
10:55
above it, is centrality a metric that's tracked
10:58
on this diagram at this point or time,
10:59
but it's not is it?
11:00
It's something that's, we're gonna look at in the future?
11:04
11:07
that's something that I think we would want to determine
11:11
how we would calculate that on the network,
11:13
and essentially try to come up with a number
11:15
which places the network just in terms of their connectivity
11:18
and their sort of their centrality.
11:20
11:22
11:26
is a force layout, force um...
11:30
Yeah, basically, a force layout algorithm,
11:31
so it uses sort of a bit of a physical simulation
11:35
of springs and connections and that sort of thing.
11:38
So it sort of approximates a physical layout.
11:42
And in this layout, what you end up with is these,
11:46
they're classed as, sort of closely connected,
11:50
will naturally tend towards the center,
11:52
and I think that's exactly what's happened in this case.
11:55
And the two that we see here actually right
11:57
in the sort of center, are,
11:59
there's the Ecology and Evolution
12:02
and then Research Data was the the other one which
12:04
is particularly central.
12:06
Now Research Data is, it makes complete sense why,
12:09
exactly, it's, it makes perfect sense why that
12:12
would be in the center, because it's something
12:14
which is totally cross disciplinary.
12:16
And I think Ecology and Evolution is a factor
12:18
of the fact, it's because it's something which is also
12:23
all of the other disciplines make reference to,
12:25
is in my view, so you know, all of the sort
12:28
of microbiology, chemistry disciplines,
12:30
they're all fundamentally about life sciences,
12:33
and Ecology and Evolution are so central to that
12:36
in many different ways, so that's my,
12:38
why that's so central.
Yeah, no, it makes sense,
12:40
it's you know, chemistry community over here
12:42
on the right hand side is obviously very much
12:44
about chemistry, biology and microbiology up the top,
12:47
and then you have ecology and evolution
12:49
which is, as you say, much more cross-disciplinary
12:53
type community and that's why it's gravitating
12:55
towards the center there.
12:57
So it's interesting to see those types of communities
12:59
which are more centralized.
13:01
I think it's something we'll be working with
13:02
Nature with, to try and understand a little bit more about.
13:06
13:08
13:10
13:14
that we've got at the moment, so main things are,
13:16
yeah, as I was saying, the network size is changing
13:19
pretty drastically, so I think 50% more registered
13:22
profiles since 2018, so pretty substantial growth.
13:26
And so yeah, the sort of tagline or the sort of way
13:29
I'd refer to it is the community of registered experts
13:31
continues to grow rapidly.
13:33
13:35
13:37
yeah, there are double the number of connections,
13:40
and so really that just shows that the overall scope
13:43
of knowledge flowing within the network
13:45
is really increasing fairly, you know, drastically.
13:48
13:50
in a sense, because you're doubling, you've got 50%
13:54
more registered profiles,
13:56
but then they're global connections,
13:57
there's obviously double, so,
13:59
from an edge to node perspective,
14:01
it's going to exponentially increase.
14:05
14:07
one profile is added, it's gonna be making multiple
14:10
connections.
Yeah, yeah.
14:12
14:15
of connectivity, which I think I talk about on the next
14:19
slide as well, if you want to move forwards.
14:22
14:22
14:23
14:24
14:25
(laughs)
14:27
Yeah, basically, another measure of you know,
14:31
sort of network measure is that of connectivity.
14:33
And I think there's a 15% increase in connectivity
14:36
since last year, and the average number of connections
14:39
has gone from 3.94 per node to 4.43.
14:45
So yeah, it's essentially, there is this sort of thickening
14:49
out of the network itself as this sort of,
14:52
the number of connections that have been made
14:55
between experts and the sort of volume of knowledge flow
14:58
is, is kind of, is increasing for each of those individuals,
15:02
as people kind of come and join.
15:05
15:07
are you aware of any kind of benchmarks or thresholds
15:11
in terms of connectivity measurements,
15:13
that lead you know, I guess, wondering whether if you get
15:17
to a connectivity level of five,
15:19
or a connectivity level of six,
15:20
do you tend to see things happen?
15:22
Does it tend to be like a trigger,
15:24
a trigger for something incredible (laughs).
15:29
I don't know, is a benchmark you get on these types
15:31
of communities, Jim?
15:33
15:35
So from what I remember, there are models that we could
15:38
apply from, I'm sort of thinking from sort of the social
15:41
science experiments, that, I have seen, sort of seen this
15:45
previously where there were some models that look at what
15:48
those tipping points are in terms of their connectivity.
15:53
But I think what would be a really interesting experiment,
15:56
would be to possibly model what that would be
15:59
for the Zapnito network, so to say,
16:02
well, at what point would you expect
16:05
some sort of exponential growth in terms of the level
16:08
of you know, under what circumstances would you expect
16:11
that to happen?
16:12
And I mean, I guess, the sort of,
16:14
I guess relevant in terms of Springer Nature,
16:16
but there are quite a lot of models in terms
16:18
of spread of diseases.
16:21
So you'll see, you know, spread of disease within
16:23
a population, there will be like a threshold level
16:25
of, I think it is connections between people,
16:28
and it's, once you reach a certain number of connections,
16:31
and number of contacts, then basically,
16:33
you then have this sort of...
16:36
16:38
It sort of becomes, yeah.
16:39
16:41
16:43
us analyzing some other data sets through time
16:46
and seeing if we can establish a tipping point.
16:50
16:52
I've got some ideas for that.
16:53
Okay, great, so.
16:58
17:01
the other sort of growth metrics, so these are a few
17:04
of the numbers that I pulled out.
17:06
So there're essentially three communities
17:10
which are pretty much just new, since 2018.
17:16
There's chemistry, device and material engineering,
17:18
behavioral and social science.
17:20
So they've all kind of been introduced more or less,
17:22
you know, during 2018 at some point.
17:25
And the growth they're showing is sort of from
17:28
a standing start, chemistry is now 8% of all profiles
17:33
are in the chemistry community,
17:34
so it's shown huge growth.
17:36
17:37
We noticed that when we launched it.
17:39
You know, it sort of, we launched it with Springer Nature
17:42
and it just took off.
17:44
17:45
It absolutely makes sense, you can just totally,
17:47
completely see it, it sort of appears.
17:48
And you sort of see similar, you know,
17:50
profile with device and material engineering
17:53
and behavioral and social science,
17:55
which are not quite as dominant, but still showing,
17:58
you know, quite major growth, you know,
18:00
from a standing start.
18:02
So yeah, wouldn't surprise me if they you know,
18:04
sort of, particularly behavioral and social science,
18:06
it's just a, it's a whole field in of itself,
18:08
and so if there's a sort of a push from Springer Nature
18:12
for instance, to sort of encourage, you know,
18:15
kind of, it will be able to create profiles
18:17
and participate in the community then, yeah,
18:19
you can expect that to grow substantially.
18:21
So.
Great.
18:23
18:25
interesting metrics, so there are certain specialist
18:29
communities which are becoming established,
18:33
so they were in the network last year,
18:37
and they are in the network this year,
18:38
and they're showing a lot of growth relative
18:41
to their small size.
18:42
So digital medicine is kind of one of the,
18:47
one of the most interesting ones,
18:48
which, 'cause it's showing 400% growth over the last year.
18:51
And interestingly, that doesn't surprise me in the least,
18:54
because I'm currently working for a med-tech company,
18:59
you know, doing pieces of work for them,
19:00
and just sort of seeing, you know,
19:03
reading about what's going on in the field.
19:04
It's huge, huge area and so,
19:07
I would you know, really expect that to grow massively
19:11
in the future.
19:12
19:14
We see that with quite a few customers,
19:15
if they, in terms of the scope and purpose
19:18
of their communities and if they manage to hit a trend,
19:21
you know, they can really ride that trend.
19:23
We've seen that happen several times
19:24
with different customers.
19:26
19:27
And I think precision oncology has doubled in growth
19:29
over the past year, and again, that's somewhat more
19:31
you know, sort of particularly specialized you know,
19:35
field, but it's still showing you know,
19:36
there's a lot of growth in these sort of specialist
19:39
communities, so as experts sort of learn
19:42
that there is a community for you know,
19:44
my particular field, then they're gonna want to participate.
19:47
19:48
Okay.
19:50
19:53
and I think I had a couple of other slides,
19:54
so, yeah, so, really just sort of looking at the overall
19:59
trends in terms of the maturer communities,
20:01
so just one thing that I pulled out that I thought
20:04
was quite interesting is that the top three communities
20:05
do remain the same.
20:06
So they are microbiology, ecology and evolution,
20:09
and the science of learning,
20:10
so they're still.
20:11
20:13
to maintain their top spot?
20:15
20:17
20:18
20:19
the growth this year.
20:23
Yeah, so those are still growing communities,
20:25
but they're still you know, sort of,
20:27
they're at the very top.
20:28
There's a lot of interest in those,
20:32
had a lot of sort of I guess, vibrancy in those communities
20:35
for them to continue being relevant.
20:38
And yeah, there are some, these other shifts
20:40
that are evident, such as chemistry is the 4th biggest,
20:45
from a standing start.
20:47
And then as we talked about before,
20:48
micro-films and microbiomes was incorporated
20:52
into microbiology, so this is kind of an interesting
20:55
point in that you know, there are some communities
20:58
which become established and are sort of,
21:00
well, you know, think that this is a community
21:01
in and of itself, but actually as you know,
21:06
the Springer Nature sort of observed,
21:07
it's like, well actually it makes more sense
21:10
for these communities to be one thing.
21:12
And so hence they were incorporated.
21:14
And I can imagine that over time,
21:17
that is gonna be a trend, you know,
21:18
there'll be sort of some you know,
21:20
some communities will join together,
21:21
some will split apart.
21:23
And one thing that I would, that I think will be interesting
21:26
will be to look for and try to predict those trends
21:30
in the future, and I think you can kind of see that
21:33
in you know, in the previous, you know, 2018,
21:37
that the two were so close together,
21:39
microbiology, and micro-films and microbiomes,
21:41
it's like, okay, these two galaxies are in the process
21:44
of colliding and becoming one.
21:45
21:49
analogy is quite in a way, it's quite accurate in a way,
21:51
because you've got, there is an element of push and pull,
21:54
and gravity in there and I think if you look at that 2018
21:57
diagram, you could see in there that they are so closely
22:00
related and you would wonder,
22:02
is there a reason why they're,
22:04
is it better for it to be separated,
22:05
or is it more beneficial to the members of that community
22:07
for it to be merged?
22:09
22:11
22:13
so, it's interesting to sort of be able to look
22:16
at the diagrams going forwards and say actually,
22:19
you know, you might not think about it,
22:20
but actually those diagrams would be better served
22:23
if they were combined.
22:25
You might even see natural splits maybe,
22:27
I guess if the connectivity within one community
22:29
is fully evidently not so, not so connected around central
22:34
you know, people in the middle,
22:35
then maybe you could say, look,
22:37
there's a split happening.
22:38
22:42
which have just not been detected.
22:45
And maybe then sort of value in helping sort of emphasizing
22:48
that and sort of encouraging you know,
22:49
that sort of, those communities and saying,
22:51
well you know, or possibly introducing.
22:56
22:59
So what's the next slide?
23:01
23:03
I think you'd hinted at, we talked a little about this
23:05
before about.
23:10
But yeah, I guess just to reiterate the point
23:11
that there are some communities that are more,
23:15
more widely connected than others,
23:17
so to me the way I was thinking about this,
23:19
is they kind of, yeah, they represent these
23:21
cross-cutting topics that are relevant
23:22
to all of the networks, and they're likely to play
23:25
a role in bridging, in you know,
23:28
sort of scientific disciplines.
23:29
So that could be an interesting you know,
23:31
sort of future trend to look at is,
23:33
you know, are there you know, sort of,
23:36
in some communities which are able to bring together
23:40
other disparate communities and sort of provide
23:42
some mechanism for cross-disciplinarity
23:45
which I think is, you know, is important in the sciences
23:48
to encourage you know, sort of dissemination of ideas,
23:51
in ways that you wouldn't find normally.
23:53
So I think that could be a very interesting
23:55
thing to observe.
23:56
23:58
and say, okay we know that there's you know,
24:01
the ecology and evolution community is fairly central
24:05
compared to the other two communities,
24:07
so you could quite easily justify promoting
24:10
the ecology and evolution community to other communities,
24:14
'cause you know, you know there's already a general interest
24:17
there, so, I think you could also use it as a kind
24:20
of justification to say look, let's promote this
24:23
other community to the members of this community,
24:25
'cause we know that there's already
24:26
a reasonable level of interest.
24:28
24:31
for recommendations and for yeah, promotions,
24:34
that's a really, that's a good idea.
24:35
24:36
Okay.
24:37
Right.
24:38
24:39
the "I'm feeling lucky button," which is
24:41
(laughing)
24:42
the community that you've probably got no interest in,
24:44
but you know, just showing something of interest.
24:46
24:47
you can send them to a random community
24:48
and sort of, I'm feeling lucky.
24:52
All right, so where does this, where does this,
24:54
where do we head to going forwards?
24:57
25:00
this is an incomplete list of future
25:03
sort of areas to look at.
25:05
I just sort of put down some of the ones that
25:06
I've been thinking about,
25:07
but I think we've talked about a few others as well.
25:10
So yeah, so the one that I think would be particularly
25:14
interesting would be to visualize the expert connections
25:16
around specific artifacts and to sort of really
25:20
hone in on let's say, the detail in certain areas
25:25
in order to really understand more about
25:27
the way that knowledge flows,
25:30
and about the way that particular individuals
25:33
may be you know, sort of,
25:37
yeah, may be sharing knowledge.
25:38
So an example I'm thinking about is there was another
25:41
company I'd been working at, who were doing,
25:43
essentially applying a similar principle,
25:45
where they had a mixed network visualization
25:48
that was showing all of the people,
25:50
and it was showing all of the artifacts.
25:52
And then you could see the relationships between
25:54
the people and the artifacts, so you could,
25:57
it sort of helped to kind of explore
26:01
the role that certain artifacts had,
26:03
and who specifically was talking to one another,
26:06
so I think that will be an interesting area,
26:07
just to sort of say, well,
26:08
if you visualize that, what would it show?
26:10
You know, what could you learn from that?
26:14
26:16
we do know that obviously the metrics are popular content
26:19
so it would be interesting to look at how that content
26:22
is being, you know, who's been looking at it,
26:24
essentially what influence has it had?
26:27
26:29
to place some popular content in context
26:35
of one another, so you could sort of see,
26:37
okay, well, let's take the top 10, you know,
26:39
articles by views, and then show the relationships
26:43
of you know, just show all the experts,
26:45
all the people who've interacted with that.
26:47
And then just see what falls out.
26:48
And you might see some interesting clusters
26:50
of experts who are like,
26:52
you know, here are two different pieces of content
26:54
from two different disciplines,
26:55
but you can see the way that those experts
26:58
are perhaps related to each other.
26:59
And they may not have realized, you know.
27:02
I kind of want them just sort of getting
27:04
into the detail of that.
27:05
And then I think another thing that I think,
27:07
you know, you and I have spoken about a few times,
27:09
is the, there are a lot of non-registered knowledge flows,
27:13
so there's a lot of views of content,
27:15
of sort of the Zapnito you know hostage,
27:19
you know, the articles in these communities,
27:21
where people are contributing the knowledge
27:23
but we don't have a good bead on who they are,
27:27
because they haven't registered as an expert
27:29
in the network, and I think that, you know,
27:31
there's a high volume of those.
27:33
So I think one thing that would be very interesting
27:34
would be to find a way to represent those knowledge flows.
27:40
For example, if we were just to go back
27:42
to the Springer Nature you know visualization,
27:44
would be to say, well can we just you know show
27:47
all of those in some form, that allows you know?
27:50
Maybe as a sort of like a second level,
27:52
you might have all of the experts
27:53
and then you have everyone else.
27:55
And to sort of show that in some kind of way.
27:57
27:59
would it, 'cause you haven't got a person to represent
28:03
the dots.
I think that's
28:04
a challenge.
Yes (laughs).
28:07
28:09
those flows, because we haven't got a number,
28:11
we have a number of views.
28:12
28:13
you know, we know the sort of individual who has
28:18
produced a piece of content that's been read,
28:19
so we kind of have almost a sort of,
28:22
a number for an expert to say,
28:24
okay you have a score, which is the number of you know,
28:27
non-registered knowledge flows out from you,
28:30
and so there was some way of representing that.
28:32
28:35
on the other diagram, in a way, couldn't it?
28:37
Yeah, it would be one way of doing it.
28:39
28:41
on this.
Yeah.
28:42
28:44
which is--
Yeah, you might get,
28:46
you might get a completely different view on that,
28:47
because you might get lots of views on unregistered content
28:51
which is currently being ignored,
28:52
and that person's influence on the existing diagram
28:55
might be small.
28:56
But actually in reality, it should be large
28:59
and so it's, there's a missing important piece
29:01
of data that we're missing.
29:02
A bit like dark matter I s'pose,
29:04
the non-registered flows are our dark matter
29:07
that we need to uncover.
29:08
29:09
29:14
(laughing)
29:15
So what else, astronomy yeah.
29:17
(laughing)
29:19
Astronomy yeah.
29:20
(laughing)
29:22
29:25
the role and the impact of non-contributing influences.
29:29
And actually this kind of relates to what you mentioned
29:31
there, which is there may be other contributions
29:34
that either they're registered profile,
29:36
yeah, in fact I think it would be the registered profiles.
29:38
There'd be other ways in which they are influencing.
29:41
And so, that will be something we sort of need to dig
29:45
into the data that's available about other activities
29:48
that you know, the registered individuals partake in,
29:52
that have an influence.
29:54
And I think the example I had was,
29:57
in one of the very early, in the very first blog post,
30:01
we're sort of looking for the,
30:02
I think I called them the lurkers.
30:04
Was the idea of individuals who were,
30:07
due to their position in the network
30:10
and due to the connections that they held,
30:12
they were actually particularly well placed
30:15
to be highly influential, because they were,
30:18
they were acting, they may not have realized it,
30:20
but they were acting as something of a bridge.
30:22
I think the interesting thing there would be if you can
30:23
identify those individuals, let them just say,
30:25
well okay, these three or four people, you know,
30:28
just due to their location, their centrality,
30:31
you know, they haven't maybe contributed much
30:33
in terms of articles.
30:34
You know what, if you were to encourage them to,
30:36
they would probably have a higher degree influence.
30:39
30:40
So they would have a double impact factor for example.
30:42
Impact factor is kind of a phrase that gets used
30:45
obviously in science research.
30:46
But you can have an impact factor attached
30:48
to an expert and based on various
30:52
information points about them.
30:54
30:55
And yeah, the--
All right.
30:58
30:59
31:01
(laughing)
31:03
31:06
measuring the impact of individual knowledge flows
31:09
in sort of downstream sharing, so that was a little bit
31:12
more sort of speculative, but I think what I was thinking
31:14
there was the idea that you know, if you have someone
31:17
you know, take, absorbs a piece of knowledge
31:19
or reads a piece of knowledge,
31:20
how has that action affected
31:24
what else they've done in the network?
31:25
So could you start to trace the flows of knowledge
31:28
through the network?
31:29
And I think this might be something that would need
31:31
a bit more sort of bit more R and D in terms
31:33
of possibly collecting additional data
31:35
from you know, from the way users are interacting
31:37
with the knowledge.
Yeah.
31:38
31:41
and--
And do it in a privacy
31:44
and compliant way.
31:45
31:48
Consent to it and all that sort of thing, so.
31:51
Yeah, as you said, I think the one that we talked about
31:53
but isn't listed here, is the idea of actually measuring
31:56
the centrality of the networks themselves.
31:59
And sort of just get a bead on that,
32:01
say, well can you measure that based on the experts
32:04
that are in there?
32:05
So, and there's yeah, I mean there's lots of other
32:08
possibilities but I think that's a nice summary.
32:11
32:13
32:14
32:15
Perfect, all right, well.
32:17
Thanks Jim for providing an overview as to the historic
32:21
work and the recent work.
32:23
It's been great to obviously see it come together
32:26
and it's always, whenever we see a new diagram emerge,
32:29
I have to say, it's always very motivating
32:31
and inspirational to see it come together
32:33
and really enjoy talking about the new ideas,
32:36
and things that we can come up with
32:37
to analyze the data.
32:38
It's always the way, you look at the data on,
32:41
you know, you think, oh there's things in there,
32:43
but you wouldn't necessarily have anticipated, so.
32:45
It's always fun when we get the time to do it, so.
32:49
32:51
32:52
look forward to the next diagram whatever it may look like.
32:55
32:56
All right, great.
32:57
Well, if anybody's got any questions
32:58
about what we've talked about today,
33:00
send them through to us at Zapnito
33:02
and we'll, probably myself or one of the team
33:05
will come back to you.
33:07
I expect Jim is a bit hard to get hold of these days,
33:09
sometimes, so you know, if you get hold of Jim,
33:11
then you're doing well.
33:12
(laughs)
33:13
All right.
33:14
33:15
33:17
Please sign in
If you are a registered user on Zapnito Knowledge Hub, please sign in